
2011 KCSE Physics Past Paper
2.2.2 Physics Paper 1 (232/1)
SECTION A (25 marks)
Answer all the questions in this section in the spaces provided.
1 Figure 1 shows a lorry moving on an inclined section of a straight road. At the back is a chain hanging from a point on a horizontal axis through the cenne of gravity of the lorry.

Figure 1
State with a reason whether the lorry is stable or not stable. (1 mark)
2 State the constant force that opposes the motion of a stone initially at rest, as it falls through air from a tall building. (1 mark)
3 Figure 2 shows a spring balance. It’s spring constant is l25Nm”. The scale spreads over

Determine the maximum weight that can be measured using this spring. (3 marks)
4 Figure 3 shows an aluminium tube tightly stuck in a steel tube.

Figure 3
Explain how the two tubes can be separated by applying a temperature change at the junction given that aluminium expands more than steel for the same temperature rise.
(2 marks)
5 Figure 4 shows two identical beakers P and Q full of water at 90°C. Two similar cold wet clothes are wrapped, one around the top of P and the other around the bottom of Q.

Figure 4
State with a reason, the beaker in which the water cools faster. (2 marks)
6 Figure 5 is a graph of net force on a body against it’s velocity as it falls through a liquid.

Determine the terminal velocity of the body. (1 mark)
7 Figure 6 shows a small toy boat floating on water in a basin. X and Y are two points near the toy.

Figure 6
When a hot metal rod is dipped into the water at point X, the toy is observed to move towards Y. Explain this observation. (2 marks)
8 When the temperature of a gas in a closed container is raised, the pressure of the gas increases. Explain how the molecules of the gas cause the increase in pressure. (2 marks)
9 Figure 7 shows part of a petrol engine, in which air flowing under atmospheric pressure passes into a constriction, where it mixes with petrol. The mixture then flows into a combustion cylinder.

Figure 7
Explain what causes the petrol to move from the petrol chamber to the air stream in the constriction when the piston is moved downwards. (2 marks)
10 State the reason why it is easier to separate water into drops than to separate a solid into smaller pieces. (1 mark)
Figure 8 shows a uniform wooden block of mass 2kg and length 25cm lying on a bench. It hangs over the edge of the bench by 10cm. Use the figure to answer questions 11 and 12.

Figure 6
11 Indicate on the figure two forces acting on the wooden block. (1 mark)
12 Determine the minimum force that can be applied on the wooden block to make it turn about the edge of the bench. (2 marks)
13 A particle starts from rest and accelerates uniformly in a straight line After 3 second it is 9m from the starting point. Determine the acceleration of the particle. (3 marks)
14 Figure 9 shows a syringe full of water. It has two identical holes A and B drilled along it s cylinder. The cylinder nozzle is closed.
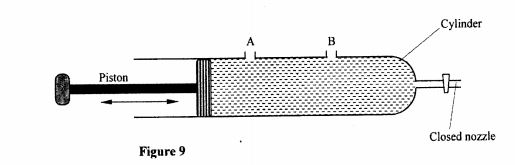
Figure 9
State with a reason how the speeds of the jets of water from A and B compare when the piston is pushed into the cylinder. (2 marks)
SECTION B: (55 marks)
Answer all the questions in this section
15 Figure 10 shows a simple pendulum of length 80cm. The pendulum bob whose mass is 50g oscillates between points A and B, through its rest position C. A and B are both 10cm higher than C.

Figure 10
(a) (i) Indicate with an arrow, on the path ACB, the direction of the greatest velocity of the bob as it moves from A to BA (1 mark)
(ii) State the form of energy possessed by the pendulum bob at point A. (1 mark)
(b) Determine:
(i) the velocity of the bob at point C, (3 marks)
(ii) the tension in the string as the bob passes point C. (3 marks)
(take acceleration due to gravity g = 10 III/S2)
(c) After some time, the pendulum comes to rest at point C. State what happens to the energy it initially possessed.
16 Figure 11 shows a stone attached to the end of a string with a uniform speed of 2m/s When the stone reaches point X on the circle, the string breaks.
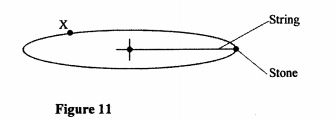
Figure 11
(i) indicate on the diagram with an arrow, the direction of the motion of the stone when the string breaks. (1 mark)
(ii) State the magnitude of the velocity after the string breaks. (1 mark)
(iii) Give a reason for your answers in (i) and (ii). ” (1 mark)
(b) Figure 12 shows a lorry towing a trailer using a rope.
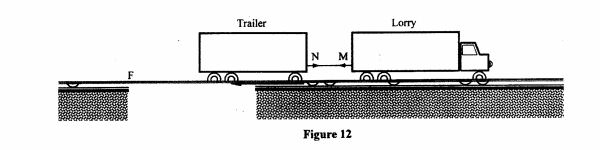
Figure 12
The lorry exerts a force N on the trailer and the trailer exerts an equal but opposite force M on the lorry. The frictional force between the trailer and the road is F. Explain how the forces N, M and F enable the trailer to move. (2 marks)
(c) Figure 13 shows a friction less trolley of mass 2kg moving With uniform velocity towards a wall. At the front of the trolley is a spring whose spring constant is 25N/m . The trolley comes to rest momentarily after compressing the spring by 3cm and then rebounds from the wall.

Figure 13
(i) Determine
(ii) the force exerted on the Wall by the spring. (3 marks)
(iii) the maximum acceleration of the trolley as it rebounds from the wall. (3 marks)
(ii) State the reason why the trolley acquires a constant velocity alter it rebounds (2 marks)
17 (a) When the temperature of water reaches the boiling point, bubbles rise to the surface.
(i) State what is contained in the bubbles. (1 mark)
(ii) State the reason why bubbles rise to the surface only at the boiling point. (1 mark)
(b) Figure 14 shows a graph of vapour pressure against the temperature of water vapour, in a laboratory where a mercury barometer indicates a height of 61.8 cm.

Figure 14
(b) (i) Determine the atmospheric pressure in the laboratory in Nm‘2. (Take g = 10m/S2 and density of mercury = 13600 kg/m3). (3 marks:
(ii) Use the graph to determine the boiling point of water in the laboratory. (1 mark)
(c) In an experiment to determine the specific heat capacity of a metal, a 100g of the metal was transferred from boiling water to a lagged copper calorimeter containing cold water. The water was stirred and a final steady temperature was realized. The following data was recorded.
Initial temperature of cold water and calorimeter = 20°C.
Temperature of boiling water = 99°C.
Final temperature of water, calorimeter and the metal = 27 .7″C.
Mass of cold water and calorimeter = 130g.
Mass of calorimeter = 50g.
(Take specific heat capacity of water as 42O0Jkg”K”‘)
(Specific heat capacity of copper as 40OJkg“K”‘).
Use the data to determine:
(i) the heat gained by the water and the calorimeter; (3 marks)
(ii) the specific heat capacity of the metal. (3 marks)
(d) State one possible source of error in the value of the specific heat capacity obtained in the experiment. (1 mark)
18 (a) Figure 15 shows a metal bolt which is threaded.
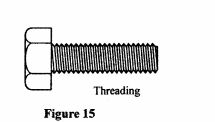
Figure 15
Explain how a metre rule can be used to measure the pitch (distance between adjacent peaks) of the threading. (2 marks)
(b) Figure 16 shows a screw jack whose screw has a pitch of 1mm, and has a handle of 25 cm long.

Figure 16
Determine the velocity ratio of the jack. (3 marks)
(c) A bullet of mass 60g travelling at 800ms” hits a tree and penetrates a depth of 15 cm before coming to rest.
(i) Explain how the energy of the bullet changes as it penetrates the tree. (1 mark)
(ii) determine the average retarding force on the bullet. (3 marks)
19 (a) State the condition necessary for a body to float in a fluid. ( 1 mark)
(b) A ship made of steel is observed to float on water yet the density of steel is approximately eight times that of water. Explain this observation. (2 marks)
(c) Figure 17 shows three stages of an experiment to determine relative density of cork which normally floats on water. To make it sink, a sinker is hung below the cork.

figure 17
In (I) a spring balance is used to measure the weight W of the cork in air.
in (ll) the spring balance is used to measure the apparent weight W 1, when only the sinker is submerged in water.
In (III) the spring balance is used to measure the apparent weight W2 when both the cork and the sinker are submerged.
The following observations were made.
W = 0.08N
W‘ = O.60N
W2 = O.28N
Use this information to determine the:
(i) upthrust on cork. (2 marks)
(ii) relative density of cork. (3 marks) (d) Figure 18 shows parts of a simple submarine, a ship that can travel both on Water and under water.
To do this water is pumped in or out of the ballast tanks.

Figure 18
Explain how the tanks are used to change the depth of the submarine. (2 marks)
2.2.1 Physics Paper 2 (232/2)
SECTION A (25 marks)
Answer all the questions in this section in the spaces provided.
1 Figure 1, shows an object placed in front of a plane mirror.
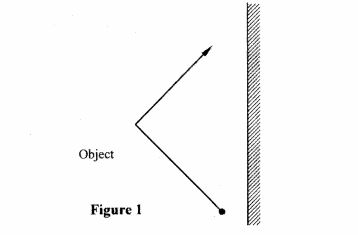
Figure A Sketch the image of the object as seen in the mirror. (1 mark)
2 Figure 2, shows two identical pithballs A and B suspended with insulated threads. They z separated by an insulator X. A is positively charged while B is negatively charged. The quantity of charge on A is three times the quantity of charge on B.
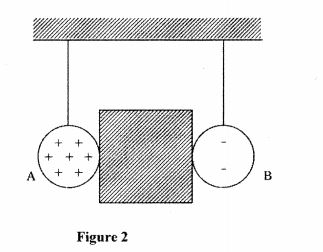
Sketch on the space besides the figure, the final position of the pithballs after the insulator removed. (1 mark)
3 Figure 3, shows a voltmeter connected across two charged parallel plates.
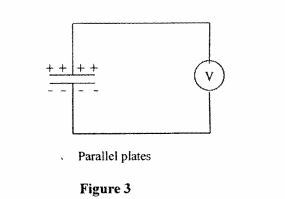
Figure 3
When a thin sheet of mica is inserted between the plates, the voltmeter reading is observed to reduce. Explain this observation. (3 marks)
Figure 4, shows the cross-section of a dry cell. Use the information on the figure to answer questions 4 and 5.

Figure 4
4 Name the parts labelled A and B. (2 marks)
5 State the use of the manganese (IV) oxide in the cell. (1 mark)
6 One method of producing a weak magnet is to hold a steel rod in the North South direction and then hammer it continuously for some time. Using the domain theory of magnetism explain how this method works. (2 marks)
Figure 5, shows a motor connected to a magnetic switch called a relay operated by an ordinary switch S1. Use the information in the figure to answer questions 7 and 8.

Figure 5
7 Explain how the relay switches on the motor when S1 is closed.(3 mark)
8 State with a reason the effect on the motor, if the iron core is replaced with a steel core and switch S, is put on and then off.(2marks)
9 Figure 6, shows standing waves on a string. It is drawn to a scale of 1:5
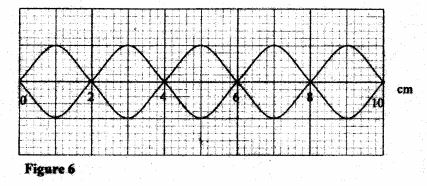
Figure6
(a) Indicate on the diagram the wavelength of the standing wave. (1 mark)
(b) Determine the wavelength of the wave.(1 mark)
10 Figure 7 , shows two rays of light incident normally on face PQ of a glass prism, whose critical angle is 42°.

Figure 7
Complete the diagram to show the paths of the two rays as they pass through the prism. (3 marks)
11 A 4Q resistor is connected in series to a battery of e.m.f 6V and negligible internal resistance. Determine the power dissipated by the resistor. (2 marks)
12 Table l shows radiations and their respective frequencies.

Arrange the radiations in the order of increasing energy. (1 mark)
13 State the reason why electrical power is transmitted over long distances at very high voltages. (1 mark)
14 State the meaning of the term “threshold frequency” as used in photoelectric emission. (1 mark)
SECTION B (55 marks)
Answer all the questions in this section in the spaces provided.
15 (a) Figure 8, shows a graph of potential difference V (volts) against a current 1 (amperes) for a certain device.

From the graph:
(i) state with a reason whether or not the device obeys ohms law. (2 marks)
(ii) determine the resisttmce of the device at;
(ii) I = 1.5A (2 marks)
(iii) l = 3.5A (2 marks)
(iv) From the results obtained in -(ii) state how the resistance of the device varies as the current increases. (1 mark)
(iv) State the cause of this variation in resistance. (1 mark)
(b) Three identical dry cells each of e.m.f. 1 .6V are connected in series to a resistor of 11.49. A current of 0.32A flows in the circuit. Determine:
(i) the total e.m.f. of the cells; (1 mark)
(ii) the internal resistance of each cell: (3 mark)
16 (a) State the meaning of the term “principal focus” as applied in lenses. (1 mark)
(b) You are provided with the following apparatus to determine the focal length of a lens:
– a biconvex lens and lens holder.
– a lit candle.
– a white screen.
– a metre rule
(i) Draw a diagram to show how you would arrange the above apparatus to determine the focal length of the lens (1 mark)
(ii) Describe the procedure you would follow. (1 mark)
(iii) State two measurements that you would take. (2 marks)
(iv) Explain how the measurements in (m) would be used to determine the focal length. (2 marks)
(c) An object is placed 30cm in front of a concave lens of focal length 20cm. Determine the magnification of the image produced. (4 marks)
17 (a) State what is meant by the term “electromagnetic induction”. (1 mark)
(b) Figure 9, shows a simple electric generator

Figure 9
(i) Name the parts labelled P and Q. (2 marks)
P …………….
Q …………….
(ii) Sketch on the axes provided, a graph to show how the magnitude of the potential difference across R, changes with the time t. (1 mark)

(iii) State two ways in which the potential difference produced by such a generator can be increased. (2 marks)
(c) In a transformer, the ratio of primary turns to the secondary turns is 1:10. A current of 500mA flows through a 20052 resistor in the secondary circuit.
Assuming that the transformer is 100% efficient, determine:
(i) the secondary voltage; (1 mark)
(ii) the primary voltage; (2 marks)
(iii) the primary current. (2 marks)
18 (a) State two differences between cathode
(b) Figure 10, shows the main features of a cathode ray oscilloscope (CRO).

Figure 10
(i) Name the pans labelled M and N.(2 marks)
N …………….
M………………
rays and electromagnetic radiations.
(ii) Explain how electrons are produced in the tube. (2 marks)
(iii) When using the CRO to display wave forms of voltages, state where the following should be connected: (i) the voltage to be displayed on the screen; (1 mark)
(ii) the time base voltage. (1 mark)
(iii) state why the tube is highly evacuated. (1 mark)
(c) Figure 11, shows the waveform of a voltage displayed on the screen of a CRO. The Y-gain calibration was 5V per cm.

(i) Determine the peak-to-peak voltage of the Y~input.(1 mark)
(ii) Sketch on the same figure the appearance of the waveform after the voltage of the input signal is halved and it’s frequency is doubled. (2 marks)
19 (a) When a radiation was released into a diffusion cloud chamber, short thick tracks were observed. State with a reason. the type of radiation that was detected. (2 marks)
(b) The half-life of an element X is 3.83 days. A sample of this element is found to have an activity rate of 1.6 x 10³ disintegrations per second at a particular time.
Determine its activity rate after 19.15 days. (2 marks)
(c) State what is meant by an extrinsic semiconductor. (1 mark)
(d) Figure 12, shows a depletion layer in an unbiased p-n junction.

Figure 12
State how a battery can be used to make the depletion layer narrower. (1 mark)
(e) Figure 13, shows an incomplete circuit of a full wave rectifier.
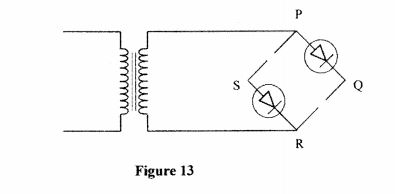
Figure 13
(i) Draw in the figure two more diodes to complete the circuit. (2 marks)
(ii) Show on the figure the points across which the output of the rectifier should obtained. (1 mark)
2.23 Physics Paper 3 (232/3)
Question 1
Part A
You are provided with the following:
– a voltmeter
– a resistance wire labelled P mounted on a metre rule.
– a resistance wire labelled Q mounted on a piece of carton.
– 2 dry cells and a cell holder.
– 6 connecting wires, each with a crocodile clip atone end.
– a switch.
Proceed as follows:
(a) Place the dry cells in series in the cell holder. Measure and record the total emf Eo of the cells.
Eo = ————V (1 mark)
(b) Connect the circuit as shown in figure 1.

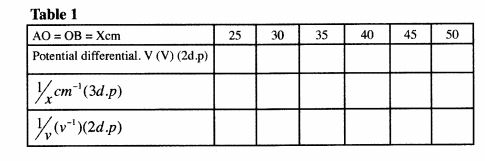
O is a point on P at the 50cm mark of the metre rule. A and B are points on P such thatAO = OB = X.
(c) Adjust the positions of the crocodile clips A and B on P such that AO = OB = X = 25cm. Close the switch. Read and record the potential difference (V) across A0 in table 1.
(d) Repeat part (c) for other values of X shown in table 1 and complete the table. (5 marks)
(e) On the grid provided, plot a graph of 1 (y – axis) against l (x axis) (5 mark)

(O Determine the slope S of the graph‘ (3 marks)
(g) Use the slope to determine the constant h, given that h = -figii. (2 marks)
Part B
You are provided with the following:
– a soft drawing board.
– a semicircular glass block.
– three drawing pins.
~ a white paper.
– a liquid labelled L.
– a dropper.
Proceed as follows:
(h) Place the white paper on the drawing board. Place the semicircular glass block on the paper and trace its outline using a pencil.
(i) At the centre of the straight edge of the outline mark a point O. Also mark a point X approximately at the centre of the curved edge of the outline as shown in the figure 2.

(j) Place the semicircular glass block on the outline. Push a drawing pin vertically through O into the drawing board. Ensure the pin is in contact with the glass block. Using a dropper, place two or three drops of liquid L on the pin, so that the liquid flows down the pin forming a thin film between the pin and the vertical face of the glass block.
(k) View the image of the pin from point X through the glass block and move the eye round the curved surface to the right side of X until the image of the pin just disappears from view. (see figure 3)

Using a second pin locate and mark a point N on the curved outline at the point where the image just disappears.
(l) Repeat part (k) with the eye moving to the left side of X. Locate and mark the point M on the curved outline where the image just disappears from view.
(m) Draw the lines OM and ON on the outline.
(n) (i) Measure and record angle MON. (2 marks)
(ii) If (The drawing bearing the candidates index number must be attached to the script).
Question 2
Part A
You are provided with the following:
‘ a 100ml glass beaker.
– a weighing balance (to be shared).
‘ a liquid labelled L.
– a measuring cylinder.
; Proceed as follows:
(a) Measure and record the mass M1 of the empty beaker.
M1 ……………………. ..g (1 mark)
A (b) Measure and pour 2ml of liquid L into the beaker. Measure and record the mass M2 of the beaker + liquid L.
M2 ………………………… ..g (1 mark)
(c) Determine the density d of the liquid L. (2 marks)
d = …………………………..
Part B
You are provided with the following:
– a retort stand, boss and clamp.
– 2 boiling tubes.
– a thermometer.
– some distilled water in a beaker labelled W.
– some liquid in a beaker labelled L.
– a large beaker containing some water.
– a measuring cylinder.
– a stopwatch.
– a tripod stand and wire gauze.
– a cardboard with a hole in the middle.
– a burner.
Proceed as follows:
(d) Clamp one boiling tube on the retort stand. Measure and pour 45ml of the distilled Water (W) into the boiling tube. Set up the apparatus as shown in figure 4.

Figure 4
(e) Heat the water in the large beaker until the temperature of the distilled water reaches ‘ 85°C. Remove the boiling tube from the hot water by lifting up the retort stand and ‘ placing it a way from the burner.
(f) Stir the water in the boiling tube using the thermometer. Record in the table 2 the . temperature of the distilled water at intervals of 30 seconds starting at 80°C until it drops to 60°C. (Stir the distilled water before taking any reading).
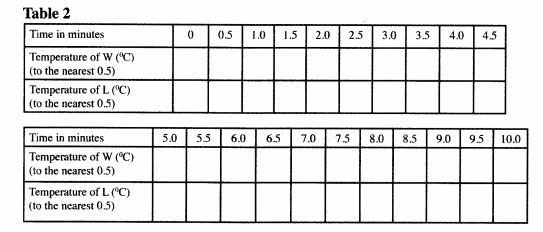
(g) Using the second boiling tube, repeat the procedure in (d), (e) and (O using 45ml of liquid L instead of distilled water. Record your results in the same table. (4 marks)
(h) Using the same axes on the grid provided, plot a graph of temperature (y – axis) against time for 1 (i) distilled water W. (5 marks)
(ii) liquid L. (3 marks)
(Lable the graphs of L and W).

(i) From the graphs determine:
2011 KCSE Physics Past Paper-Marking Scheme/Answers
10.2 Physics Paper 2 (232/2) 1. Object lmage §“< I \ \ \ 1/ \ 1 x r \ I \ 1 \ 1 \ 1 » / \ 1 s1 ~. Figure 1 Figure l Image (lateral inversion); (1 mark) (accept full line) 2 . W // % ++ +++ ++ A B Figure 2 Pithballs repelling (1 mark) 3. Mica raises capacitance; hence lower potential difference; since V = Q/C but Q is constant. 4. A = Carbon rod (+); (l mark) B = Manganese (VI) oxide (1 mark) 5. Manganese (IV) oxide is a depolarizer/oxiding agent; (1 mark) » 6. Hammering causes domains/domains to vibrate; As they settle, some face North South due to earth’s magnetic field; (2 mark) 7. When S is closed, current flows in solenoid magnetizing the iron core; this attracts the iron armature closing the contacts; this causes current to flow in the motor circuit; Motor keeps running continuously; (3 marks) 339 = WU zasigme 3zl1=a»$m€aei; Q 5 II. 8. Steel would remain permanently magnetized causing current in mortor circuit to remain ( when S is open. 1 9. (a) z . I l ~ I new ‘ , ‘ 1 1 1 ; § …………. -_,_ \ . Figure 3 Any two correct vertical lines (1 (b) 2.5%: 10 X 5 19 7»=20 cm; (1 10. P Q ke 20 R Figure 4 Figul’e4 (31 ll. _K P R Z 6><6 4 <2‘ = 3-6 =9W 21 4 (b 12. Radiowaves Microwaves Yellow light Gamma rays; ( 1 13. High voltage leads to low current hence low power (PR) losses; (1 l4. The minimum frequency of an incident radiation to cause emission of photo electrons. (1 340 WU gfipwana Eeflgmfibeas Q ! l ’ SECTION B 15. (a) ii (i) Does not obey ohm’s law;. Graph is non-linear i.e. current is not directly proportional to p.d.; fl (ii) at 1= 1.5A . R = gradient of tangent at I _ 9.2 – 4.8 _ 3.6 — 0.1 P9!“ £l’|r|> = 1.269101; ‘ at I= 3.5A l R = gradient of tangent at I _ 9.4-7.2 _ 5.4- 1.5 ww \Ol\) = O.56Qi 0.1 ; (m) R decreases as I increases; (iv) Change (increase) in temperature; (b) (i) (ii) vW=1.6+1.a+1.6=4.sv=E; Let r to be the combined internal resistance Using E = I(R +r); 4.8 = 0.32 (11.4 + r); for one cell, r = = 1.29 (1 mark) (1 mark) (2 marks) (2 marks) (l mark) (1 mark) (l mark) (3 marks) * 16. (a) The point at which rays close to and parallel to the principal axis converge or seem to diverge from after striking the lens; (b) (i) 341 l __ ‘ ‘ 1’ . ” ‘ — —-.—_ (1 mark) z \>\r 2 Er c1 3 = [VI/Tn/J :51-mgvalnnu ;1]J§:c’1i’.§§ l8 19 2( 2 ll (by / Lens SW96“ \_\ l7 \ Candle \ //-lens holder / Mme rule ./ // (ii) Candle is placed at a certain distance from the lens. The distance between the screen and the lens is adjusted until a sharp image is focused on screen. (m) The distance of candle from lens (U) is measured; The distance of screen from lens (V) is also measured; (iv) The values of U and V are substituted in the equation 1 .. l_ cl T _ u + v . . uv f 1s then computed as f = m <<>—-<>-<»-<>—- \,§,_t ,- S»- – ‘=-;zo’w g_-3-2 _ 60 __ ;:;§i -60 =-12 _l M_u _—l2 — 30 =O.4 a) The production of induced e.m.f when the magnetic flux linking a circuit is (b) (ii) changed; (i) P – brushes Q – slip rings 342 (3 mar 1 (2 marksfl I (4 marksl (1 marki E‘ = ‘aw Q ;: 7 = i 77 H ‘ V Correct peak At least I cycle (m) Increasing number of turns/coils; Increasing speed of rotation; Increasing strength of field; Winding the coil on soft iron core. Any two correct Vs = 200 x 0.5 = 100V; (C) (i) &_L NS_.V1 (ii) _ 100 _ VI,—- W X 1- (m) &_L vii, LE 100* 1) I _ 0.5><100 P‘ 10 I,,=5A 18‘ (a) -Cathode rays have charge but e.m radiations don’t have charge; -Cathode rays are particles and have a mass but e.m radiations are Waves; ( l mark) (2 marks) (l mark) (2 marks) (2 marks) -Cathode rays travel at a speed depending on the accelerating voltage but e.m radiations travel at the speed of light in vacuum; – Different in the mode of production. (any two correct) (2 marks) (b) (i) M – grid; i N – accelerating anode/anode/vacuum; ; ~ 343 (2 marks) 1 ujfil gnapistma 3fi~§m§aa’1§s g -___? , 17 18 (W) Cathode is heated by filament; electrons are released from cathode; by thermionic emission (ii) (2 mar (m) (I) across Y-Y plates. (ll) across X-X plates. (2 mar ‘ to reduce collisions, (hence ionization) with air molecules in the tube. (1 m (c) (i) peak-to-peak voltage = 5 X 2 = 10v (ii) 31., ___2 . W . _1__1 1 AAA, ssss v~/ ’ : 1 1 1 §._ < … __ …_.__._.1é,. . __4__.._._ lc 1 1 1 F” 1 1 1 19. (a) 0t – radiation; 7 short range with intense ionization hence thick tracks; J (2 mar (b) No. of half-lifes = l39§ = 5 Activity 0 1 2 3 4 5 Days 0 3.83 7.66 11.49 15.32 19.15 Activity 1.6 X10³ 8 X 10² 4×10² 2 X10² 1 X 10² 0.5 X 10² 2 Activity = 0.5 X 101 1 _ = 50 disintegrations per second 11 ‘ (2 markfl (c) A semiconductor in which impurities have been added to change conductivity. (I marbi 1 (d) By connecting it in forward biased mode (i.e. P to + and n to -) ‘ (1 marli 344 ‘ e , 4 -7 f’:\>\r Ir cfl. & : 7 7 T W mmpmnn? _;t1Jfic’1i’;§ (B) P , I Q ’ R (i) Correct diode direction; (ii) Across QS; 10.3 Physics Paper 3 (232/3) 1. Part A (a) Eo = 3.0 1 0.2V (d) Table 1 4 ‘E (2 marks) (1 mark) (1 mark) AO= Bo = Xcm 25 30 35 40 45 50 p.d \/ (V) 0.58 0.66 0.74 0.80 0.90 0.92 +(¢m-1) 0.04 0.033 0.029 0.025 0.022 0.02 + (V1) 1.72 1.52 1.35 1.25 l.ll 0 for V -5- mark for each correct value – L . x 1 mark for at least 4 correct values – Tl; 1 mark for at least 4 correct values – (e) graph (see attached) – axes labelled + units – suitable scale – points plotted -5- mark for 4 points – straight line (1) Slope – correct interval correct evaluation S = 34:3 8 (g) h correctly evaluated from T EOS substituting 345 _-*1 ‘ – ” *‘____ _ (3 marks) (1 mark) (1 mark) (1 mark) (1 mark) (2 marks) (1 mark) (l mark) (l mark) (I mark) (1 mark) 1 v\rww-IIn—ny-.1111!-..Ii;ch1Io-co_nIn 1 WU §naa»:.:a§ %§m§_fir£ Q l 1 1 2 L ( evaluating (1 mark) l PART B (i) OM and ON shown on outline. (1 mark) LM(9N = 2A =1441» (ii) q correctly evaluated (1 mark) Total (1 2. PART A 9 marks) (H) Ml = 53.5g (1 mark) (b) M2 = 73.0g (1 mark) (c) Correct mass liquid L = 19.5 g. . (1 mark) density = evaluate from candidates values of Ml and M2 PART B (f) Table 2 Temperature of W(%C) 80 79 77.5 76 75 74 72.5 71 7 0 69 Temperature of L(%C) 80 76 75 72 70 68 66 64.5 6 2.5 61. 5.0 5.5 6.0 6.5 7.0 7.5 8.0 85 9.0 9.5 10.0 Timeinminutes 0 0.5 1.0 1.5 2.0 [25 3.0 I35 14.0 4.5 68 67 66 65 64.5 63.5 62.5 61.5 61 60 59’ I Correct temperatures of distilled water 6 points x 5 to 9 points Correct temperatures of L 8 and more 4 to 7 points (h) Graphs (see attached graphs) (i) – axis labelled + units – appropriate scale – points plotted correctly 6 correct points 3- 5 correct points – smooth curve (ii) – points plotted correctly 346 (3 mark: (1 mark} (3 mark: (1 markj (1 mark: (2 mark: (1 mark (1 marki WU gnepwmar %iI,L’1’r1:rETlJJ31i,§ Q – 6 conrect points A – 3 – 5 correct points ‘ – smooth curve points § (i) (i) (value obtained from the graph (value obtained from the graph (i) r = correct evaluation 0.78 x 4.5 r = 3.0 1 0.1 347 Total (2 marks) (1 mark) (1 mark) (1 mark) (1 mark) (1 mark) (1 mark) (20 marks) WU gapwmx 25:?-at~*:.#mr=*¢1J=¢’:,§: Q L i
